
By Steve Tepper, CFP®, MBA

If you had to guess, would you say there have been more bull markets (stretches of time the S&P 500 rose more than 20%) or bear markets (times when stock prices fell 20% or more)?
Maybe your answer depends a little on basic knowledge and a little on general confidence in capital markets. If you’re a pessimist, you might think of all the downturns and resulting misery, just over the last couple of decades, and conclude stocks are a losing gamble. On the other hand, if you have faith in capitalism and know markets rise over time, you’d probably guess there have been more up markets.
Sorry, trick question. The correct answer is, going back nearly 100 years to 1926 through March of 2020, there have been 17 bear markets and 17 bull markets. Exactly the same number!
Not very encouraging, right? Market goes up and down same amount. What’s the point of investing?
The point is the downs and the ups aren’t equal. Not even close. In fact, somehow, over those 94 years, with the same amount of bull and bear markets, a $100 investment in the S&P 500 would have grown to $863,000 in 2020¹.
The 17 bear markets produced declines between 21% and 80%, while the range of the bull rises was between 21% and 936%. In all fairness, bull markets have an advantage: a bear market is limited to 100% on the downside. Nevertheless, even with a narrower possible range for bear markets, rising markets have made up for losses many times over.
The chart shows not just how dramatic the bounces are following bear markets, but another important aspect of bulls: They tend to last much longer. The average bull market lasted 56 months (nearly 5 years), while bears averaged just 10 months.
Exhibit 1: Bull and Bear Markets 1926-2020
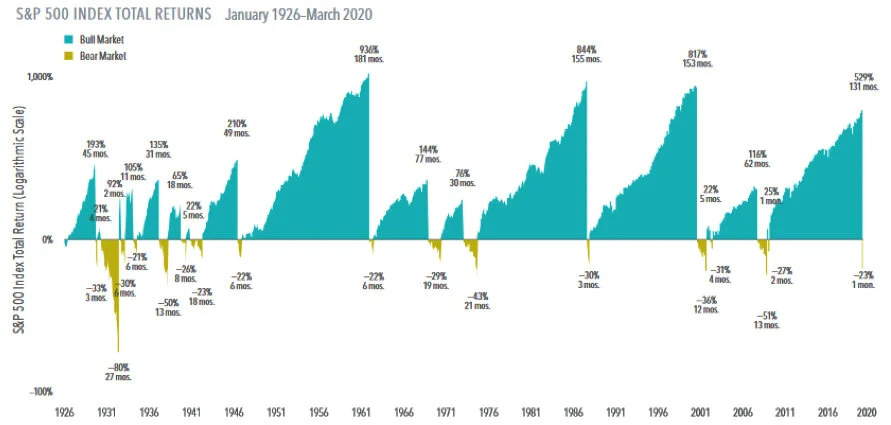
The bear markets seem to be bound by more than the 100% rule. Other than the Great Depression, no market drop has exceeded 51%, and only four of the 17 were more than 40%. The average percentage drop (not accounting for different values) was about 33.9%. On the bull side, ten of the 17 boom periods amounted to 100% or more, with an average of 256%!
Of course, not every bear will be 33% and not every bull will be 256%. Investing would be a lot simpler if they were! But it’s easy to see how a few relatively small pullbacks followed by giant advances can lead to tremendous growth in a portfolio over time.
So how does the bear of March 2020 fit in? From peak to trough, February 19 to March 23, the S&P fell 33.9%, the same as the 94-year average. (No, I didn’t plan that!) As of the day I am writing this, the S&P has already come all the way back and is trading higher than it was on February 19. Does it go up another 200% from here? No idea. But it is clear discipline has rewarded long term investors, and no reason to doubt it will continue to, whether now or in the future.
Past performance is no guarantee of future results. Indices are not available for direct investment; therefore, their performance does not reflect the expenses associated with the management of an actual portfolio.
In USD. Chart end date is 3/31/2020, the last peak to trough return of −23% represents the return through March 2020. Due to availability of data, monthly returns are used January 1926 through December 1989; daily returns are used January 1990 through present. Periods in which cumulative return from peak is −20% or lower and a recovery of 20% from trough has not yet occurred are considered Bear markets. Bull markets are subsequent rises following the bear market trough through the next recovery of at least 20%. The chart shows bear markets and bull markets, the number of months they lasted and the associated cumulative performance for each market period. Results for different time periods could differ from the results shown. A logarithmic scale is a nonlinear scale in which the numbers shown are a set distance along the axis and the increments are a power, or logarithm, of a base number. This allows data over a wide range of values to be displayed in a condensed way.
Source: S&P data © 2020 S&P Dow Jones Indices LLC, a division of S&P Global. All rights reserved.
Dimensional Fund Advisors LP is an investment advisor registered with the Securities and Exchange Commission.